Auptimizer Dashboard
Dashboard is a powerful analytics tool that complements Auptimizer’s core hyperparameter optimization (HPO) and model compression capabilities.
Use the Dashboard to:
Supercharge the analysis of your HPO or model compression experiments. The dashboard provides insightful visualizations to help you analyze and contrast jobs, experiments, and optimization approaches. Get to the root of your experiment results by exploring the interplay of hyperparameters, the progression of intermediate results, and the efficacies of different HPO algorithms.
Get a snapshot of the information that matters. Use the dashboard to track experiment progress and get clutter-free insights on the ongoing and completed experiments.
Run your experiments with ease. Create, launch or stop an experiment or even set up a new Auptimizer environment using the dashboard.
Launch the dashboard
There are two ways to launch the dashboard:
In terminal, use the
dashboardcommand to visualize an exisiting Auptimizer experiment that is currently running or has been completed:dashboard --port <port_number> --path <path_to_database>
The
portis the port number to show the dashboard on the local machine. Thepathshould point to the database (default is sqlite3.db) for the corresponding experiment.Use the
launch_dashboardflag and thedashboard_portflag (optional) when starting an HPO or compression experiment:python3 -m aup exp_config.json --launch_dashboard --dashboard_port <port_number> python3 -m aup.compression exp_compression.json --launch_dashboard --dashboard_port <port_number>
If
dashboard_portis not provided, a random port will be assigned. The local host address will be shown in the console when the experiment starts.Important: With this second approach, some dashboard functionalities, like starting a new experiment or restarting a past experiment, will be disabled. For full functionalities of the dashboard, please, use the first approach.
Track experiment status and visualize results
Main page
When you open the dashboard in a web browser, you will first land on the main page with a list of completed and active experiments. This page presents the meta info of each experiment.
You can check the experiment configuration via the CONFIG button, and access detailed results via the RESULTS button. Here, you can also stop or start an experiment.
The page also offers a tile view layout that provides the same information as the list view.
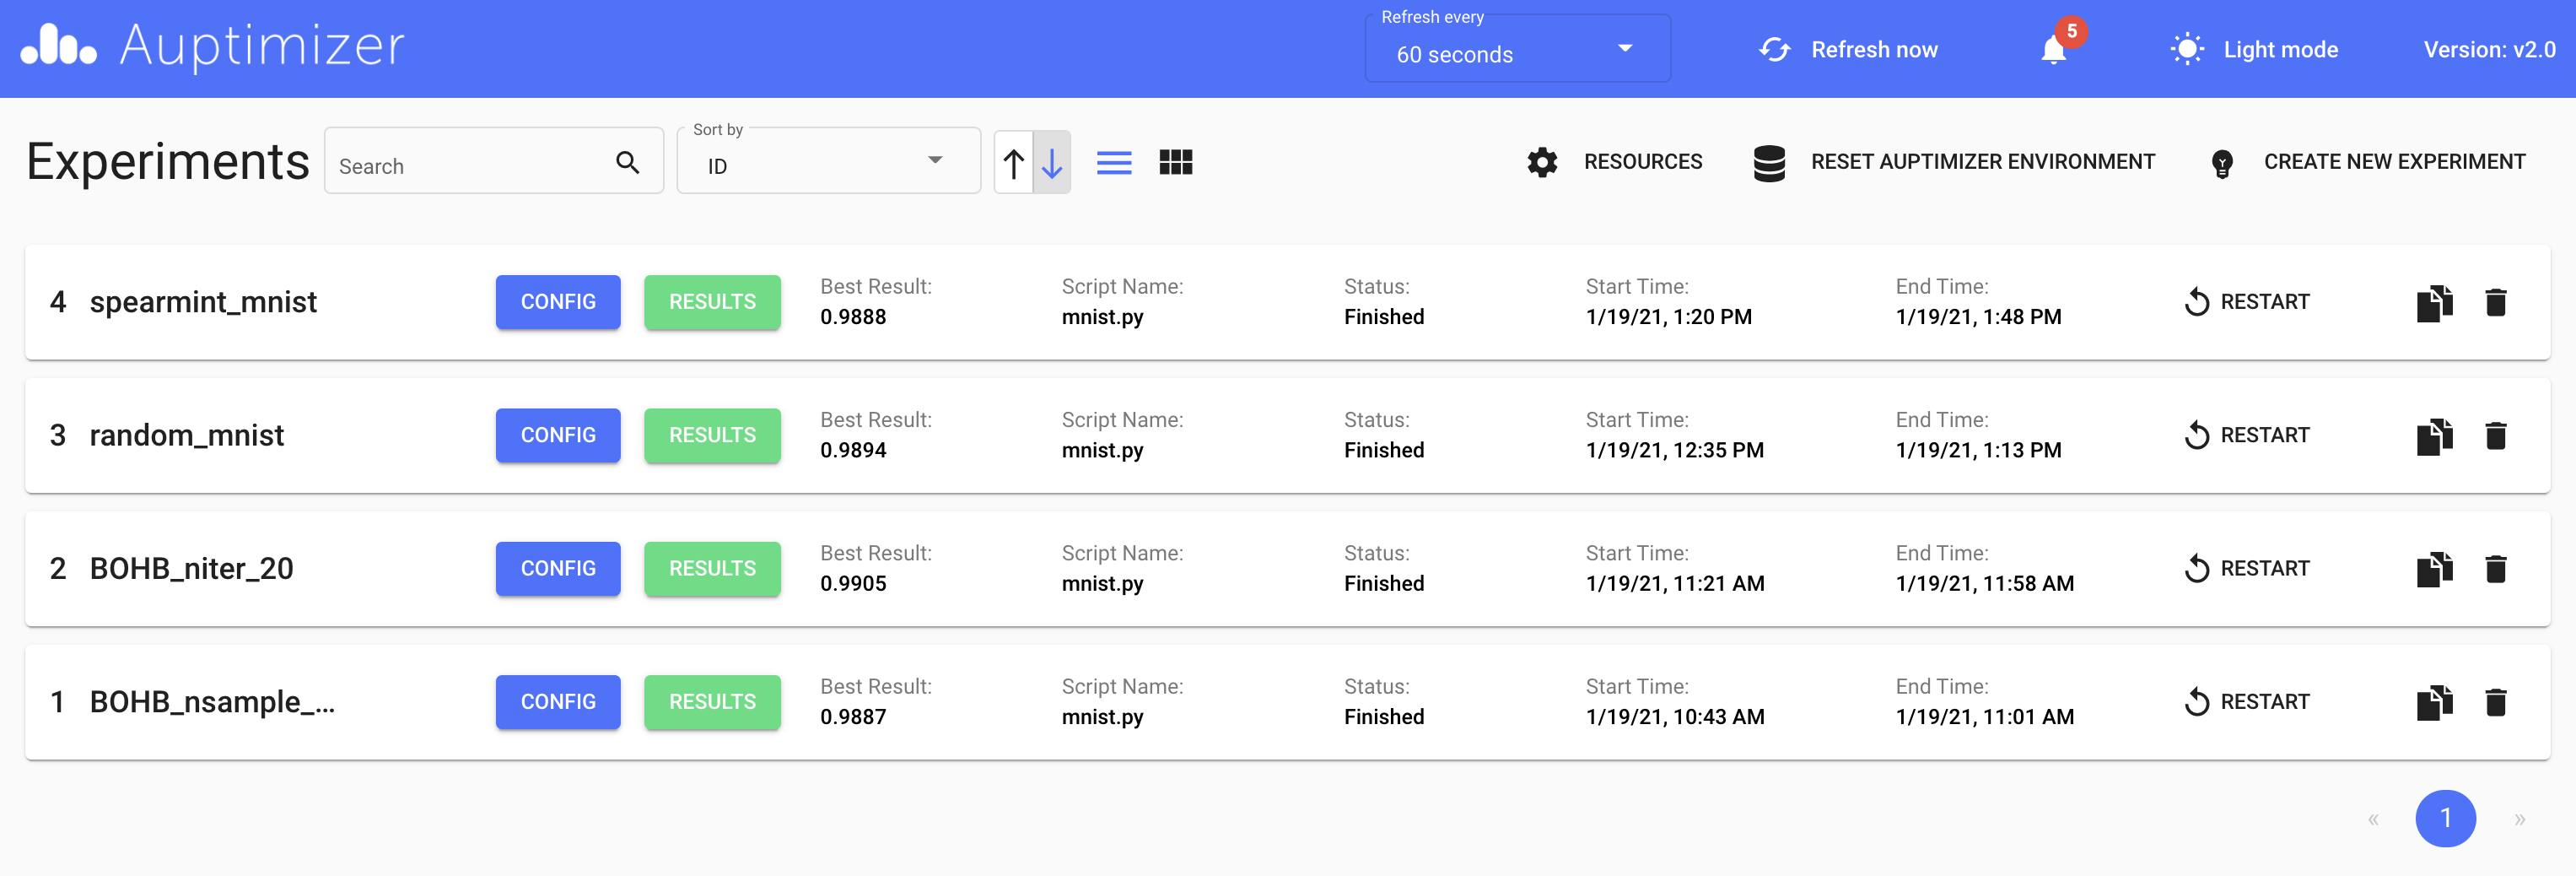
Main Page List View
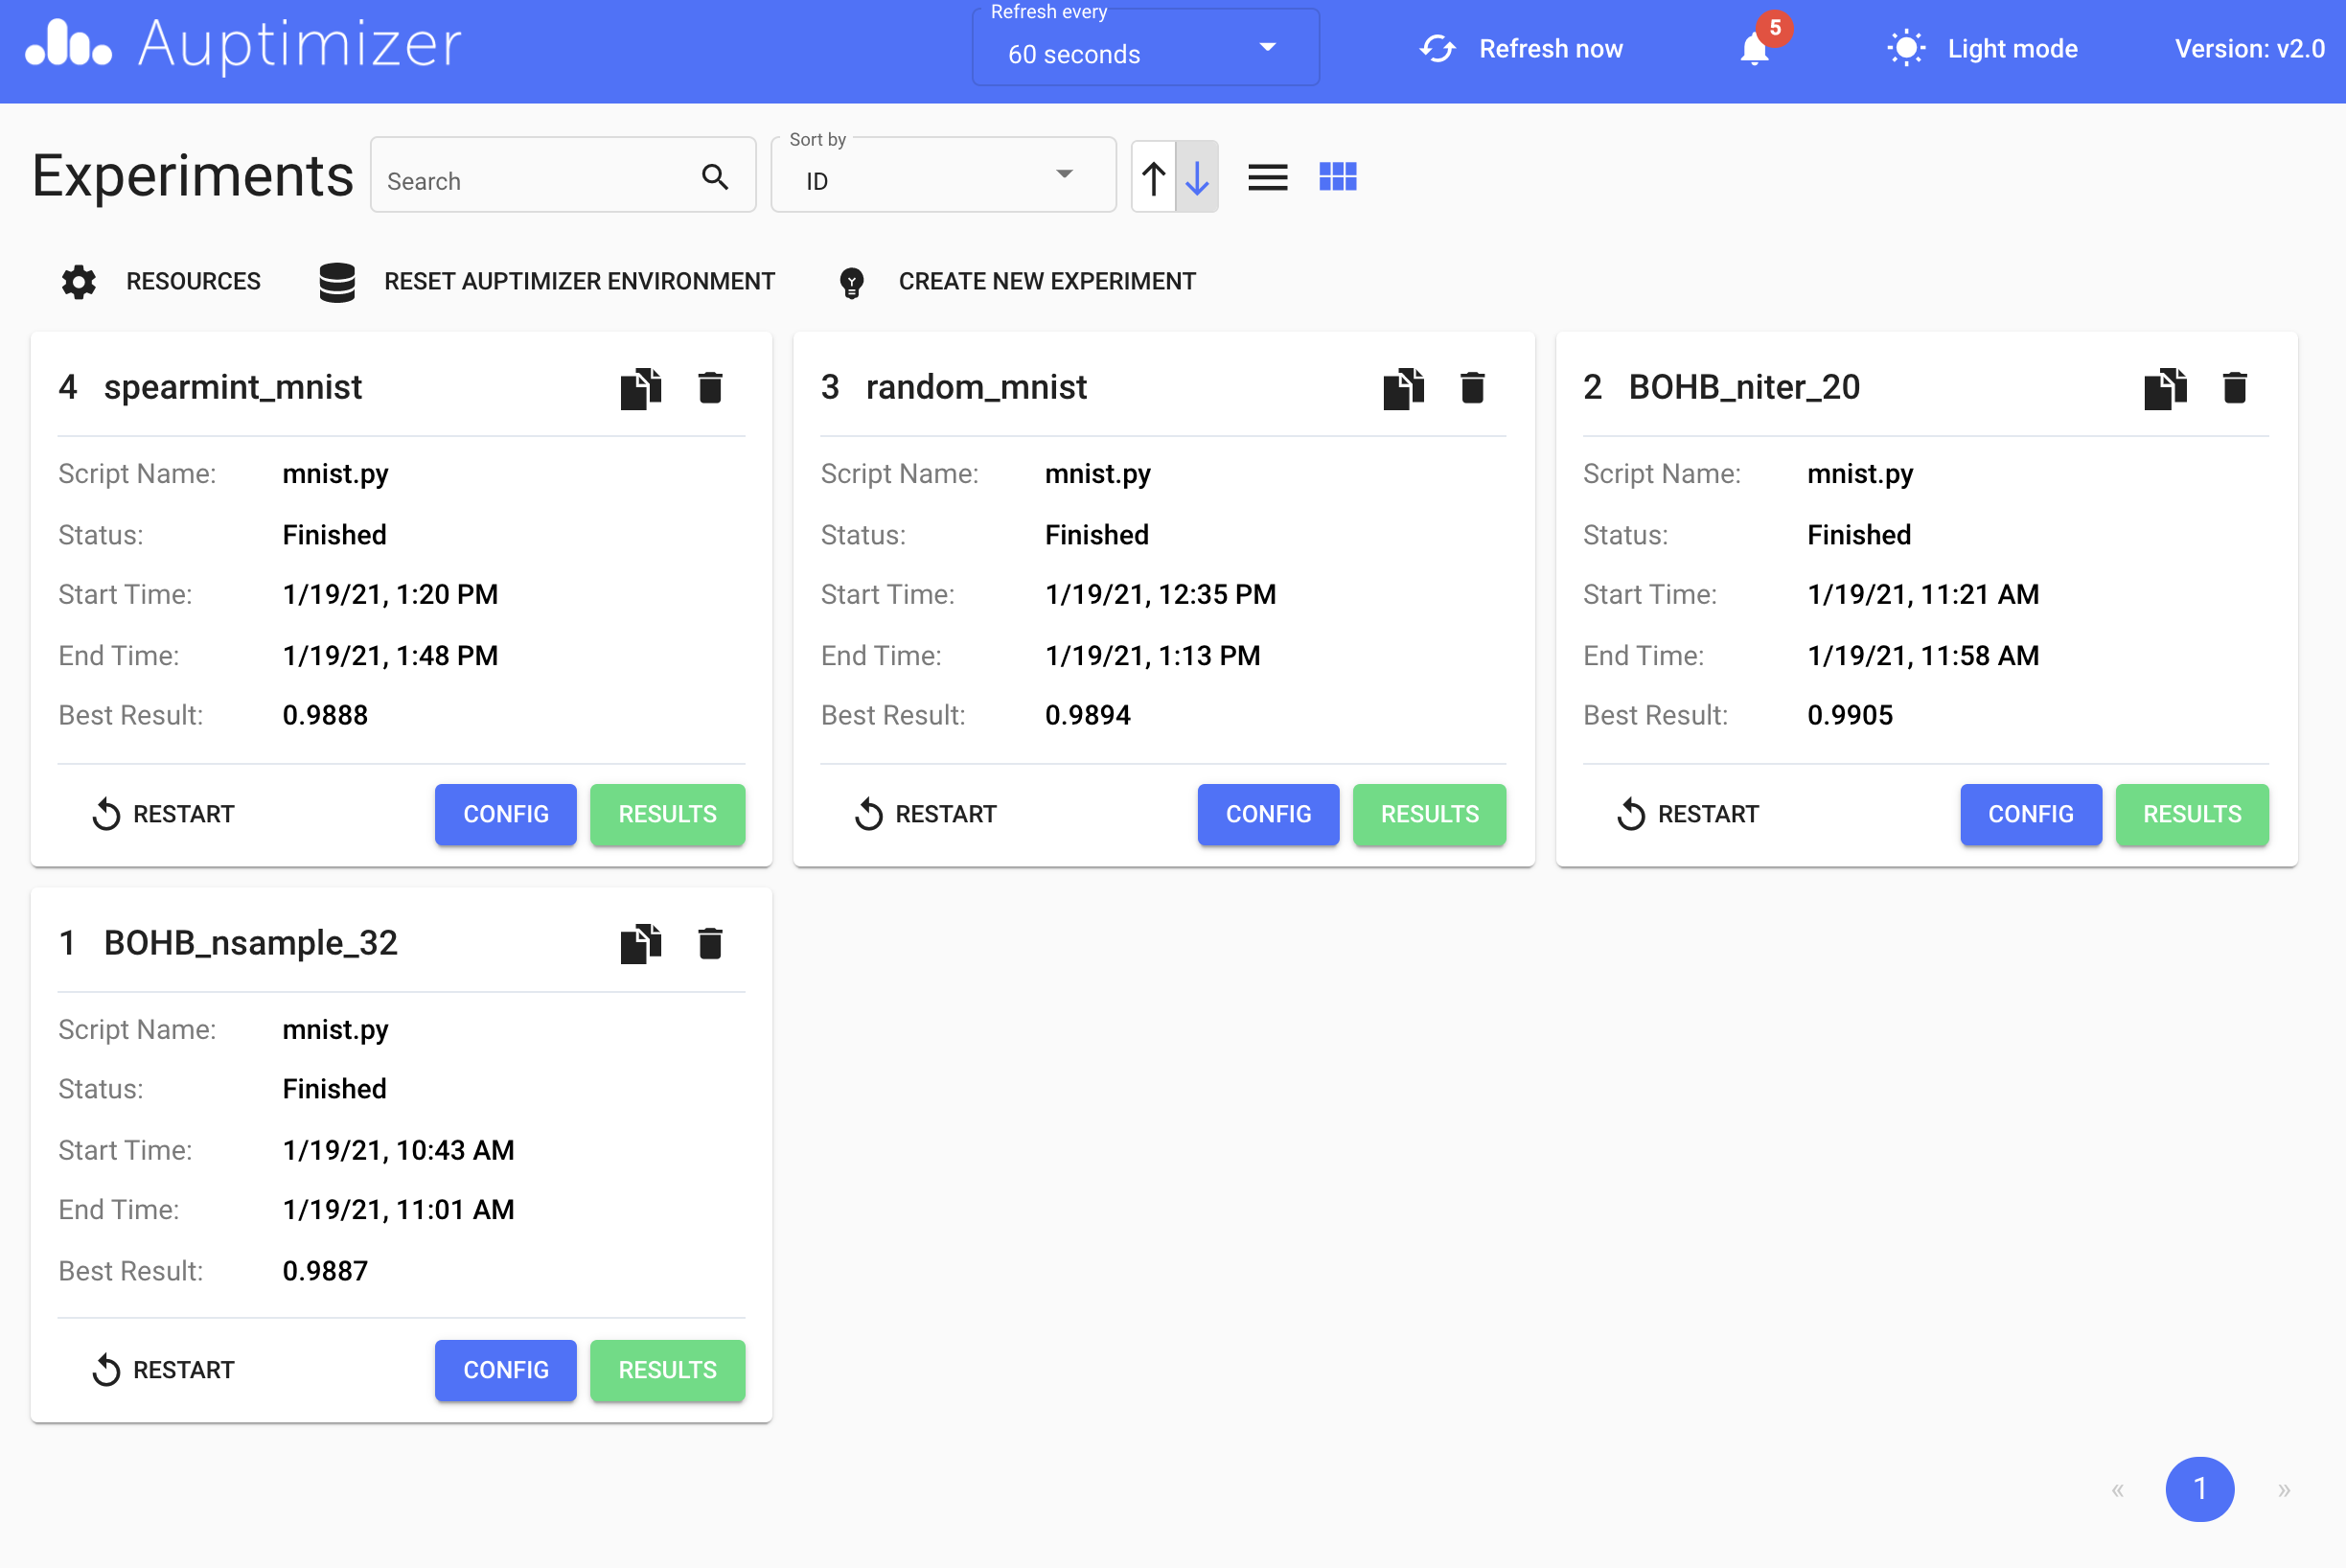
Main Page Tile View
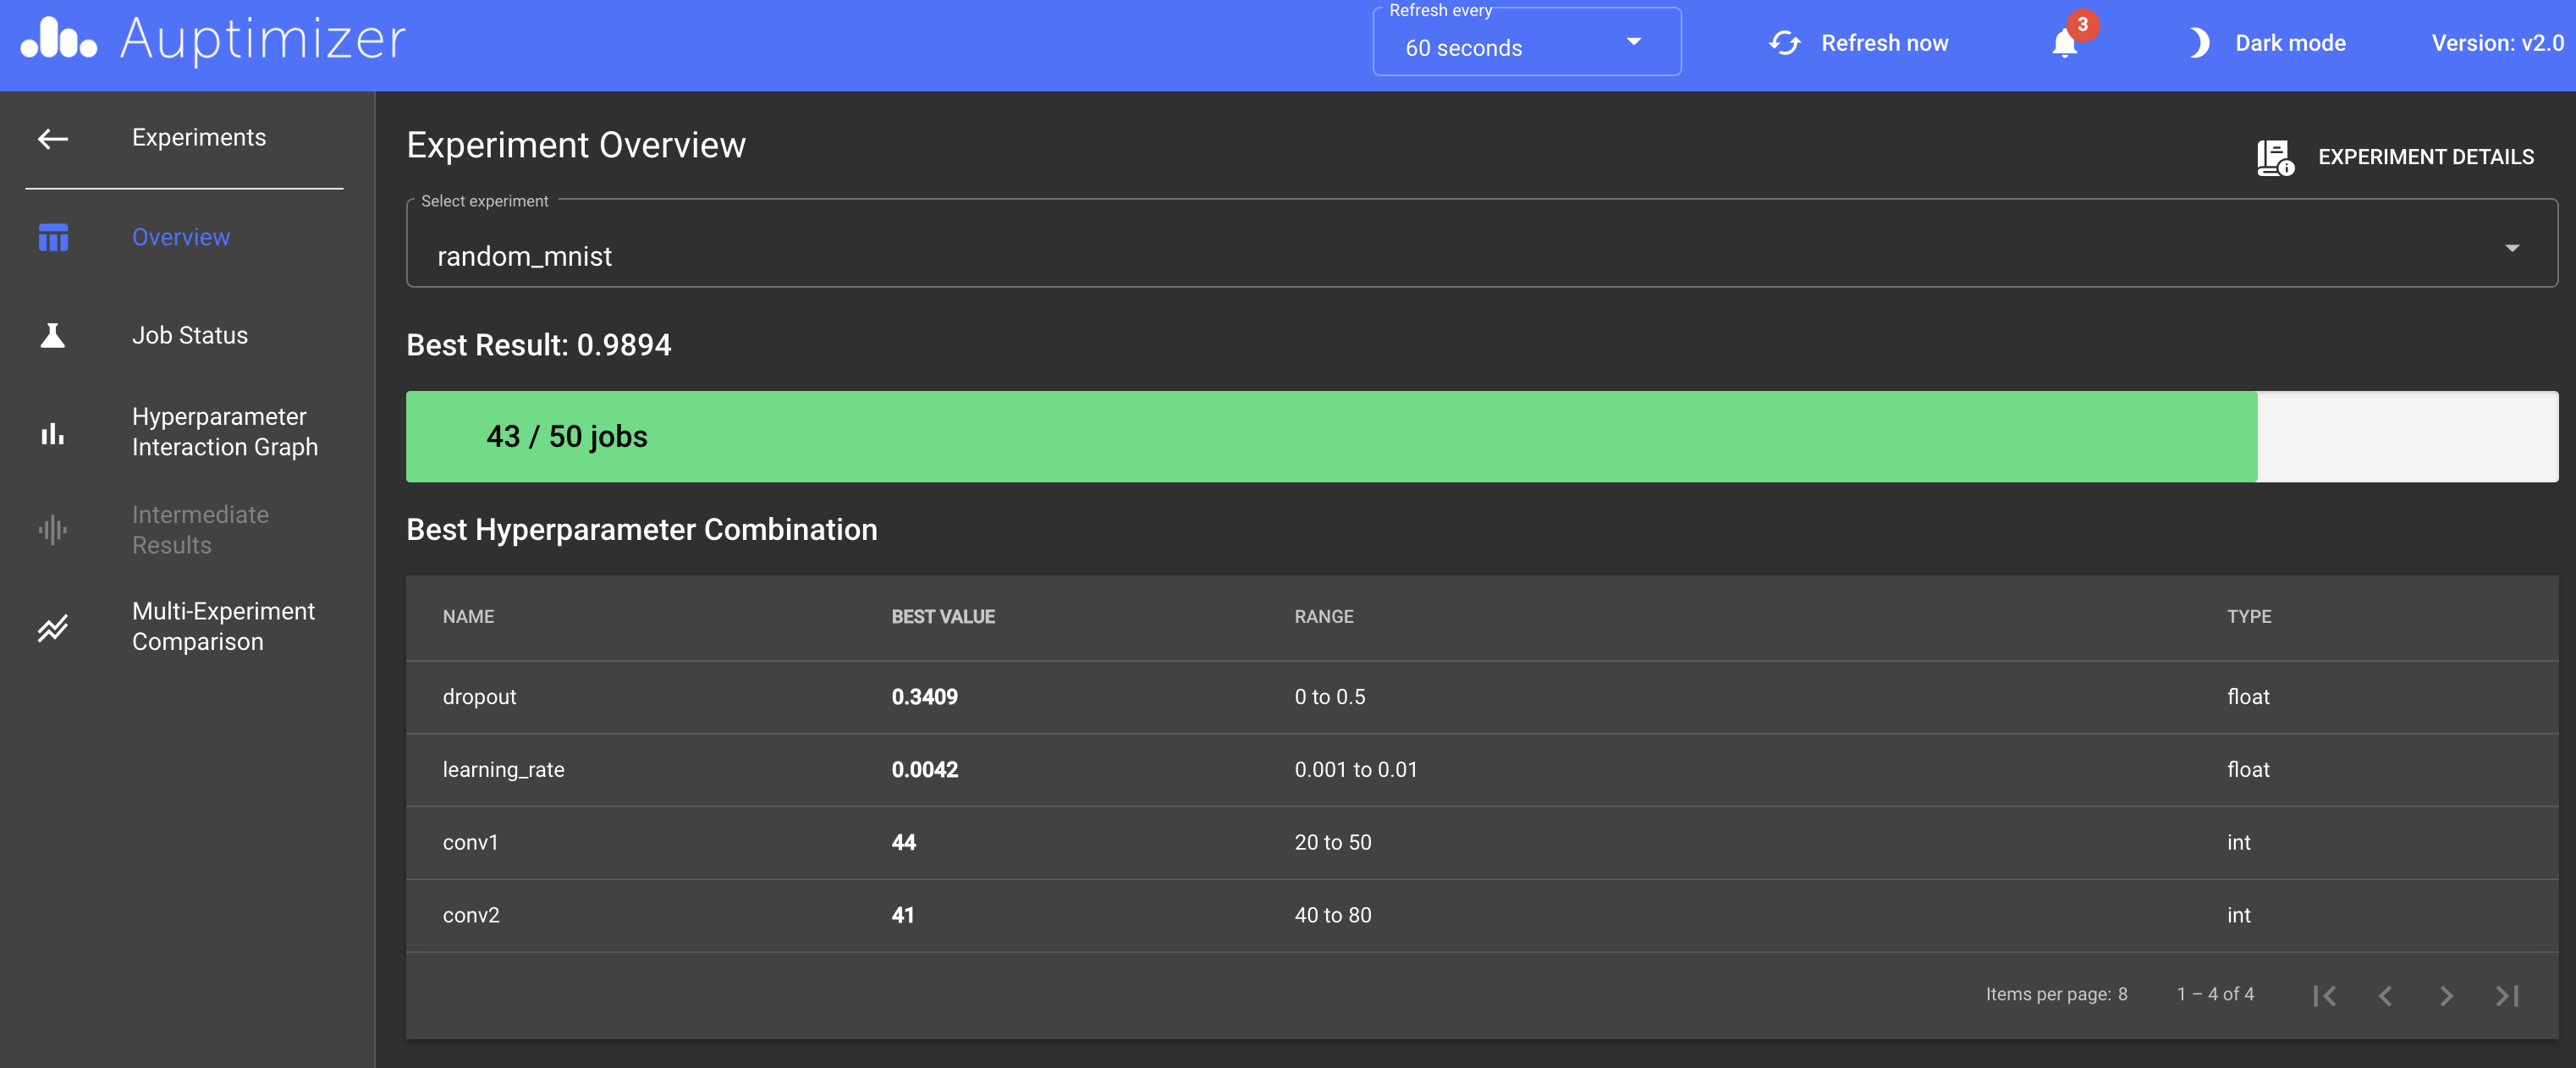
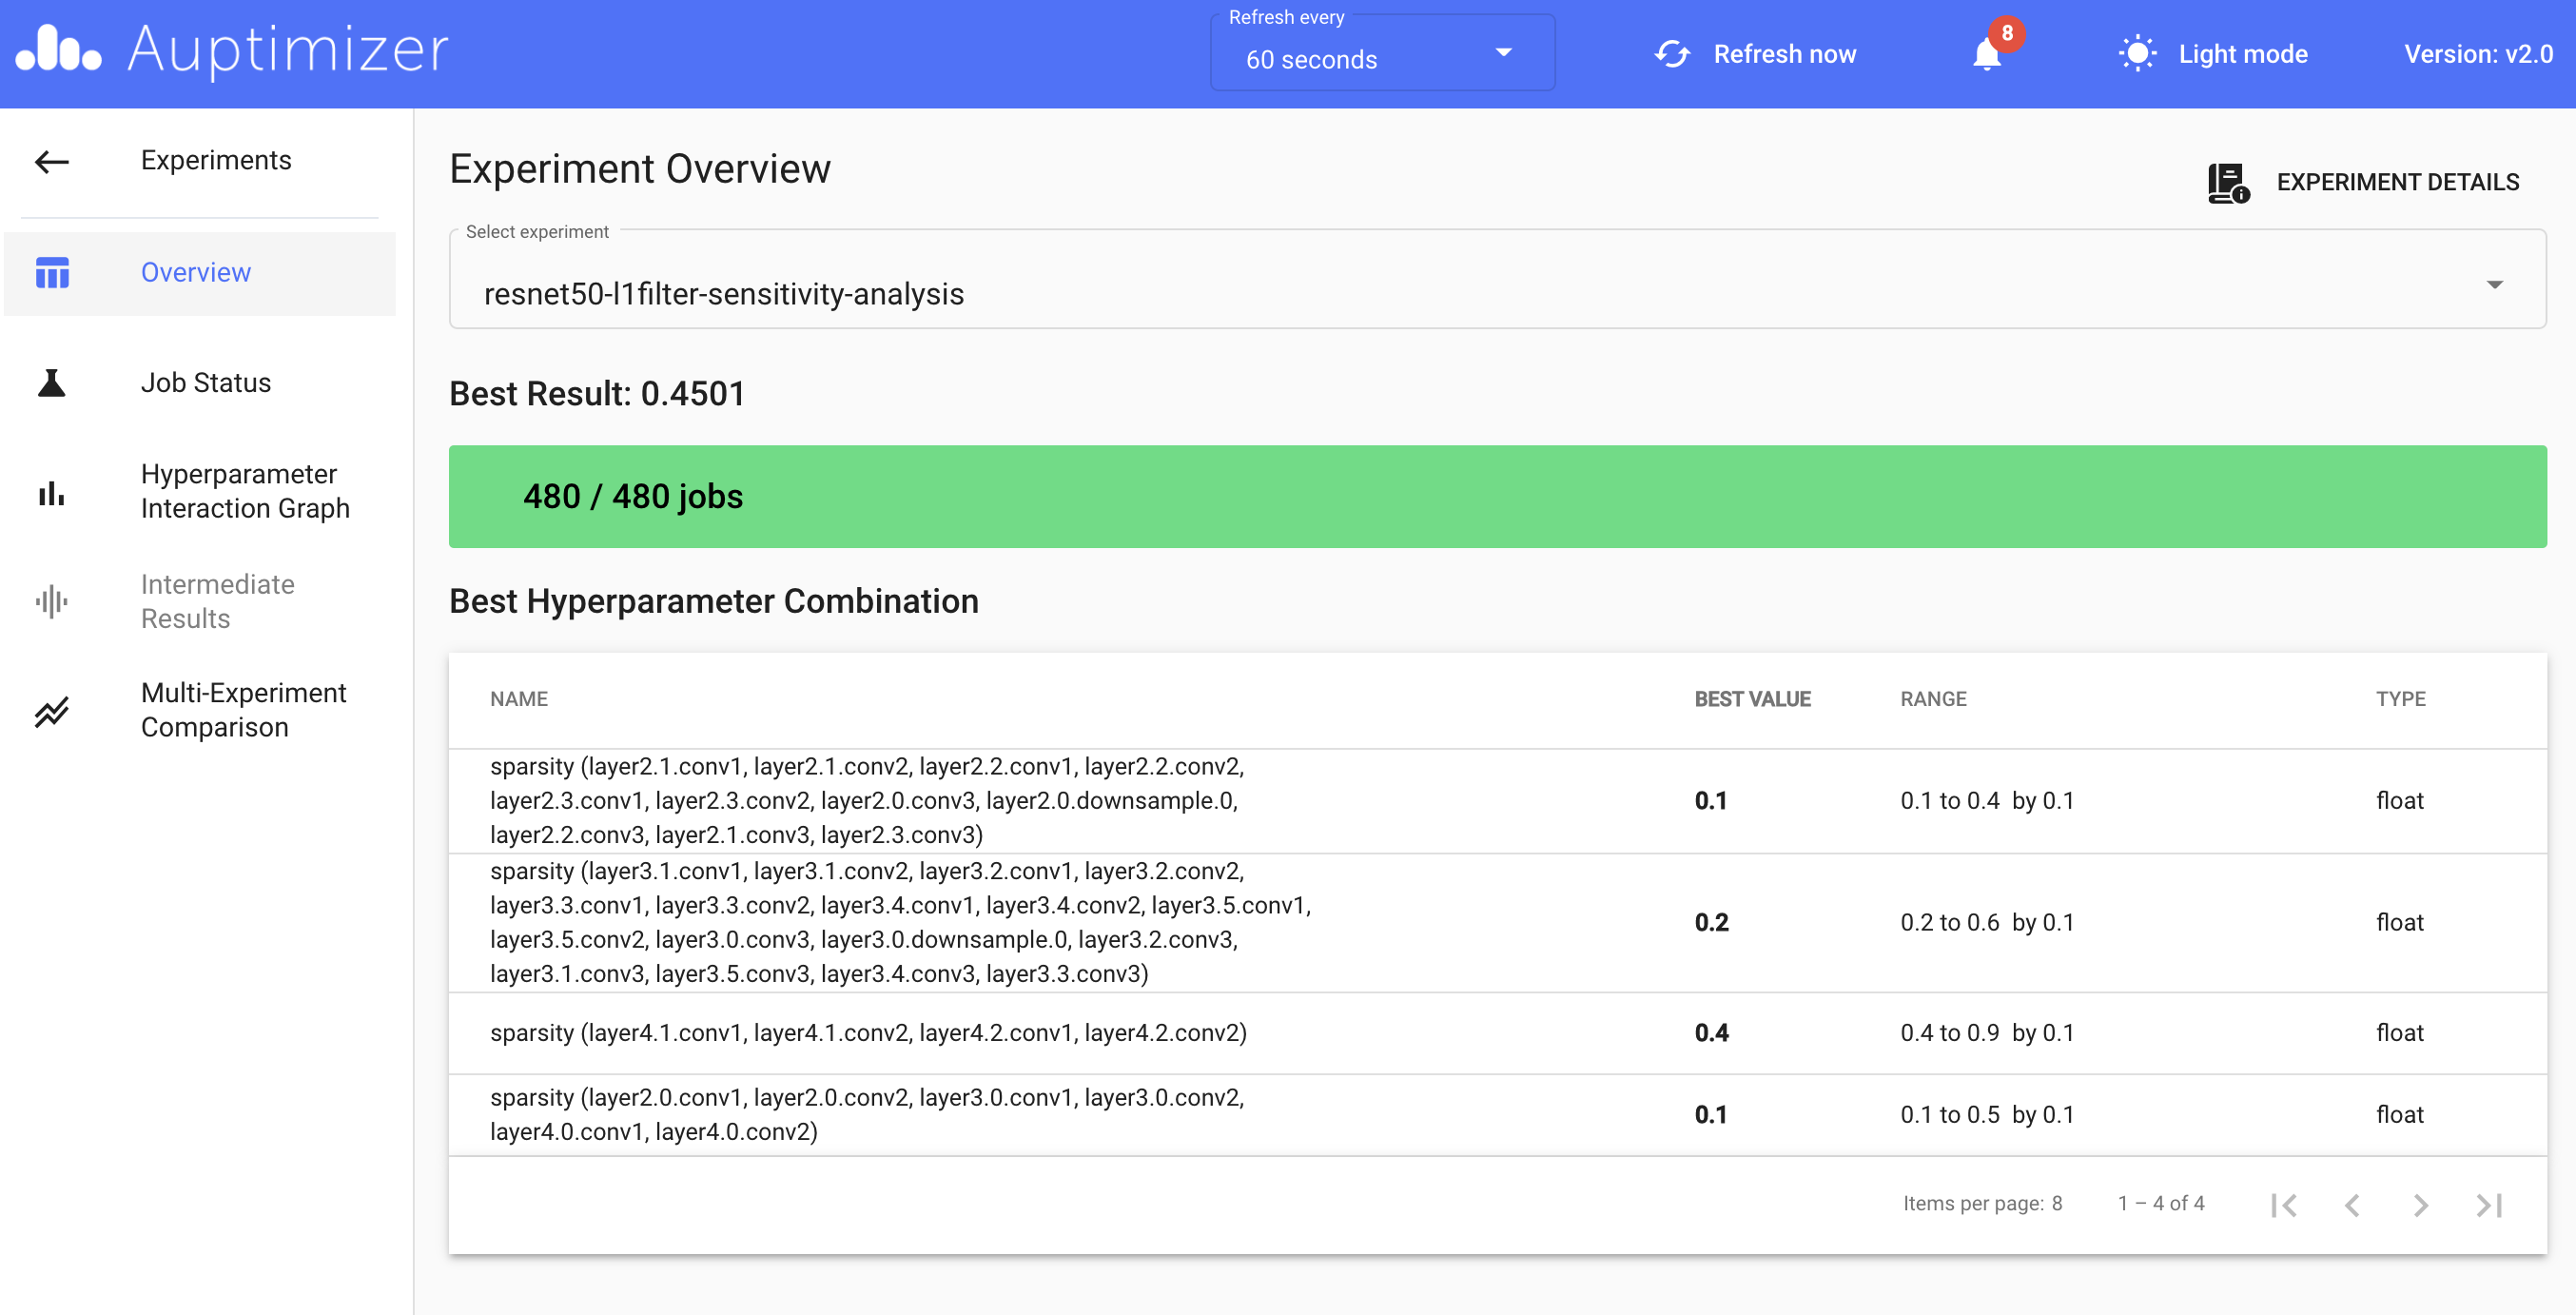
Experiment overview
This page provides a summary of an experiment’s status and the best result and corresponding best hyperparameters so far. You can also select other experiments to view without going back to the main page.
Experiment Overview
Job status
The Job Status page shows the status, result, and hyperparameters of each job. Job details are presented in a scatter plot and a table.
By default, the user-defined score used for HPO will be plotted for each job, while the best result over finished jobs is shown with a line. You can zoom in/out,
check out details of each data point, and change the range of axes on the plot. Please refer to INTERACTION GUIDE for exploring the plot. If you return multiple
metrics in an experiment, the other metrics can be shown on this plot as well.
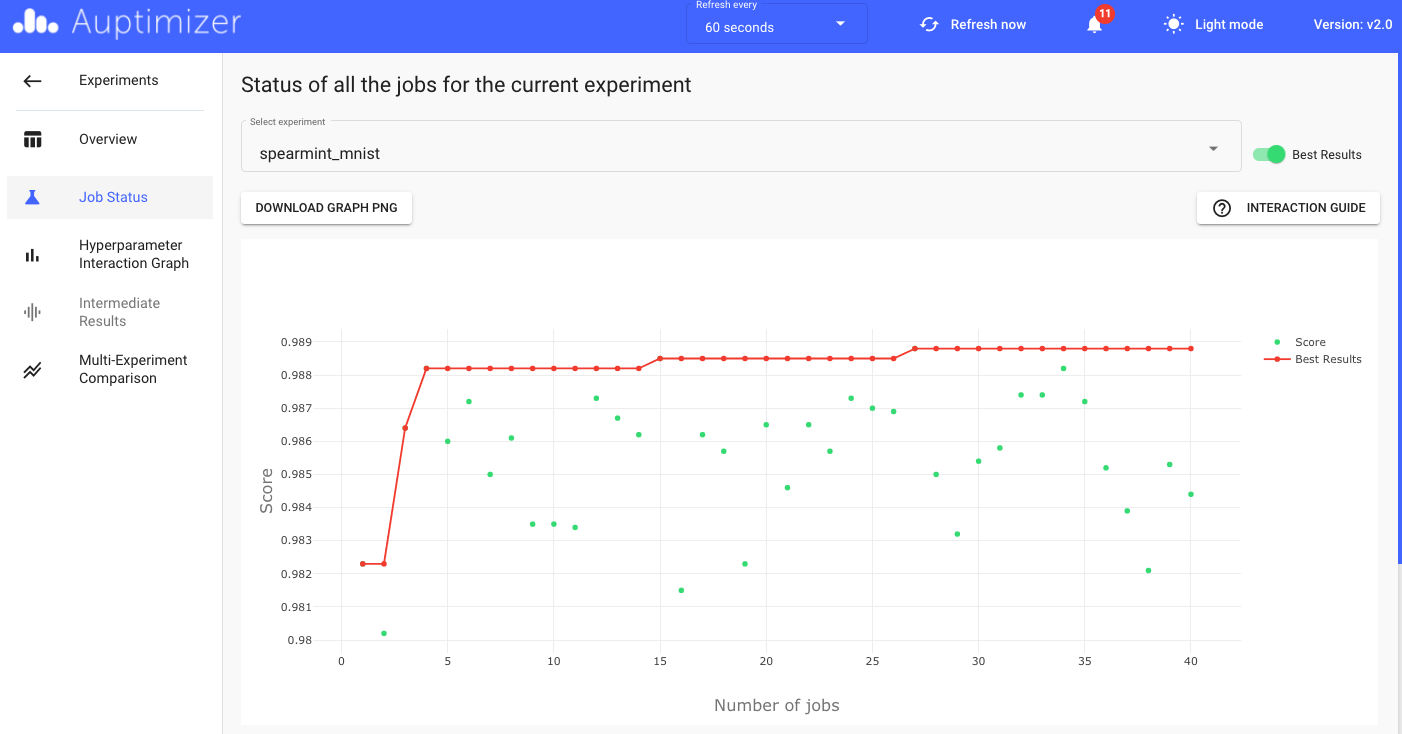
Job Status Plot
The job status table presents more detail for each job, including status, score, start/end time, all hyperparameters, etc. The table can be sorted by each column and exported as xls/xlsx/csv/txt file.
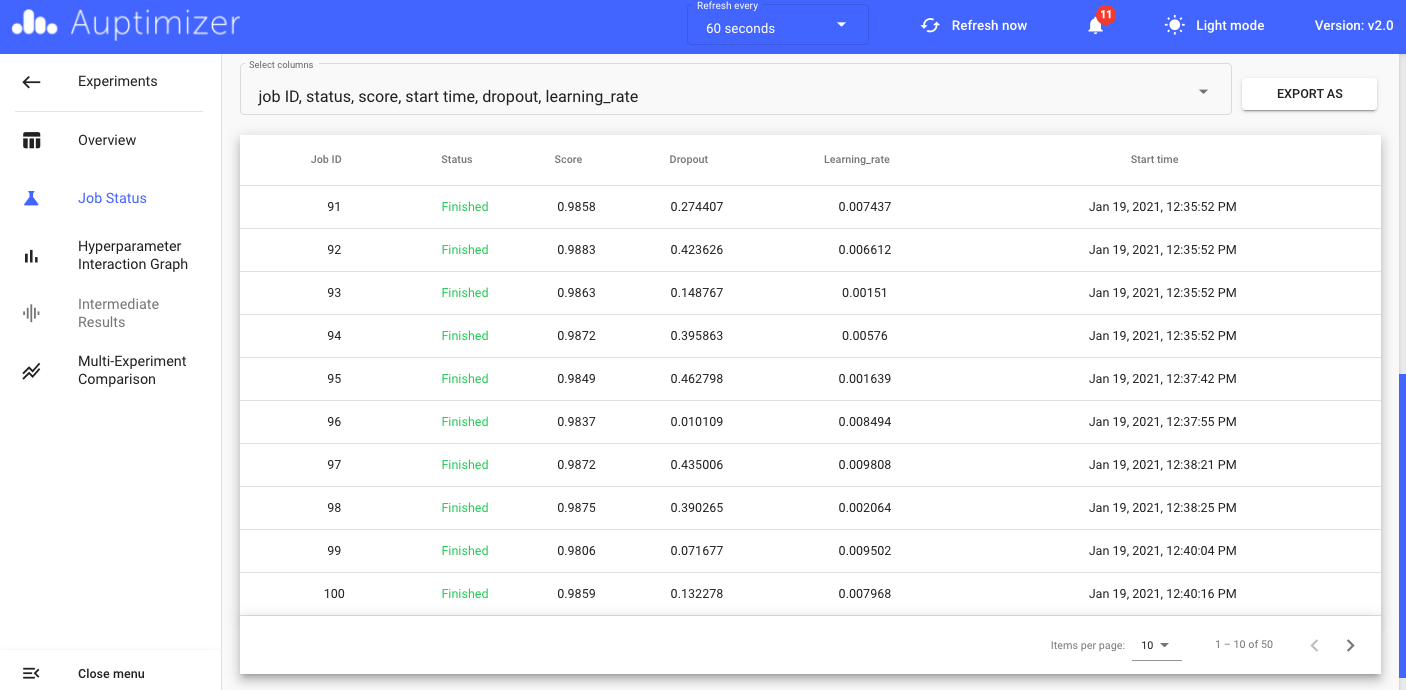
Job Status Table
Hyperparameter interaction graph
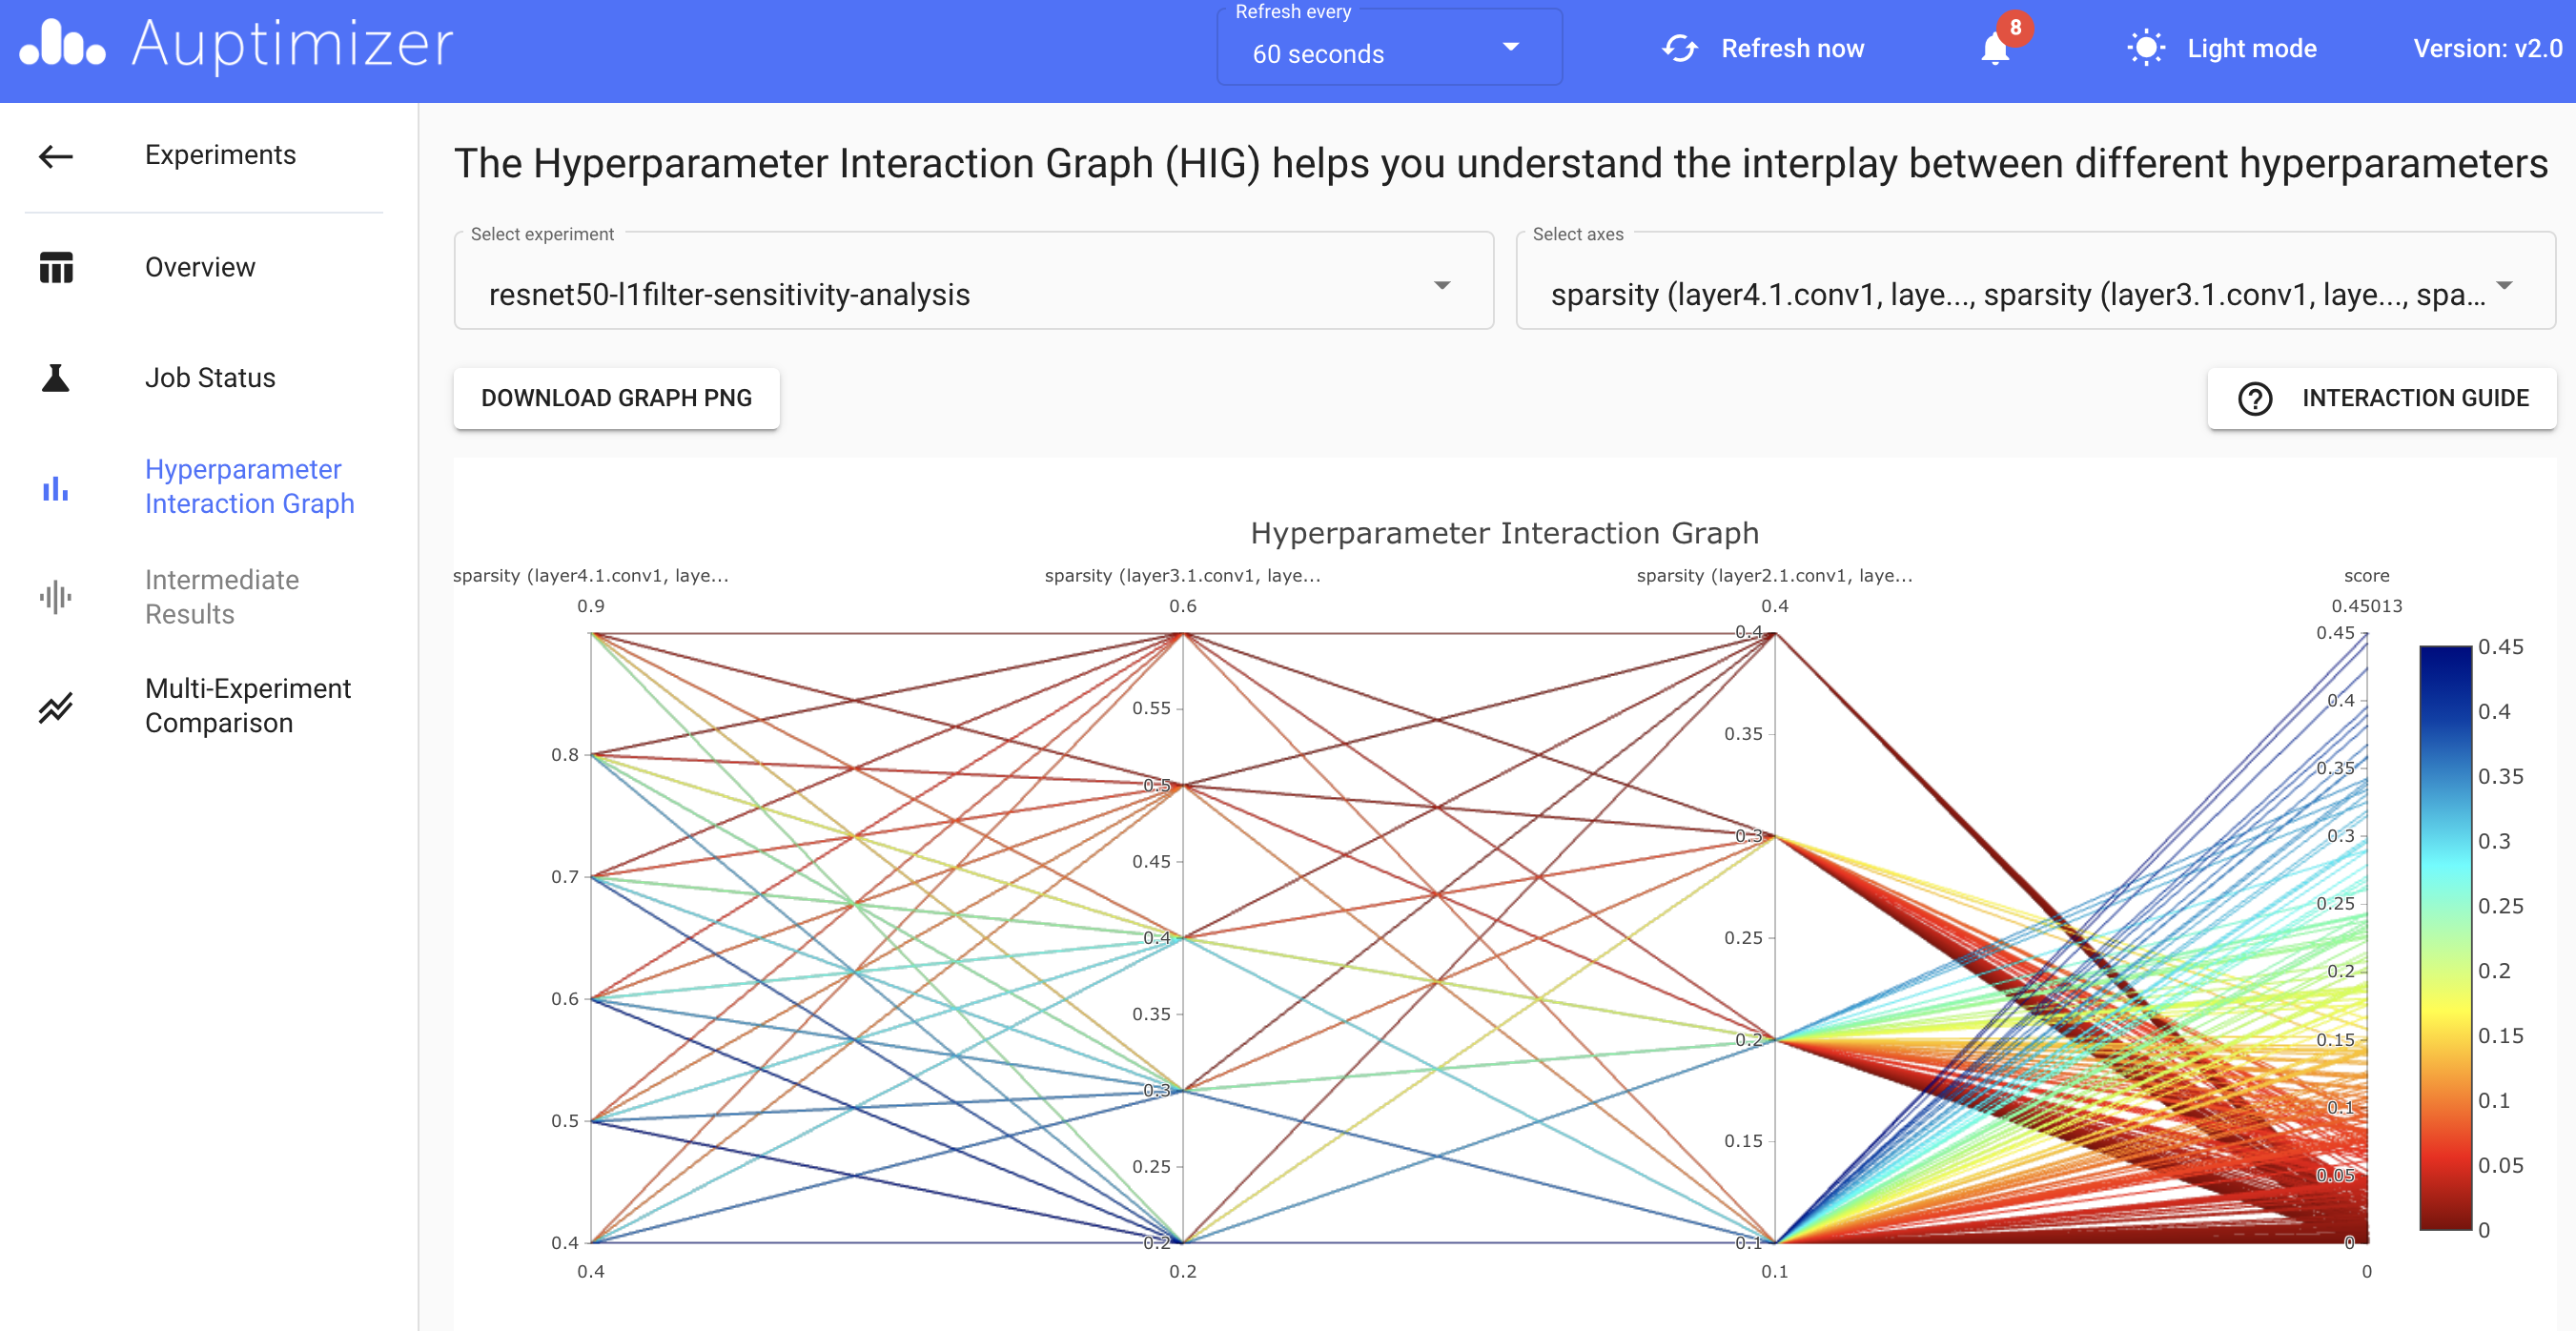
The hyperparameter interaction graph (HIG) is a parallel coordinate graph that is commonly used to show the interplay among different hyperparameters. Each vertical axis represents the range of one hyperparameter. You can interact with this graph by selecting certain hyperparameters, moving the vertical axes, highlighting certain ranges of one or multiple hyperparameters, etc. This HIG can provide more insights into the impact of each hyperparameter on the evaluation metric.
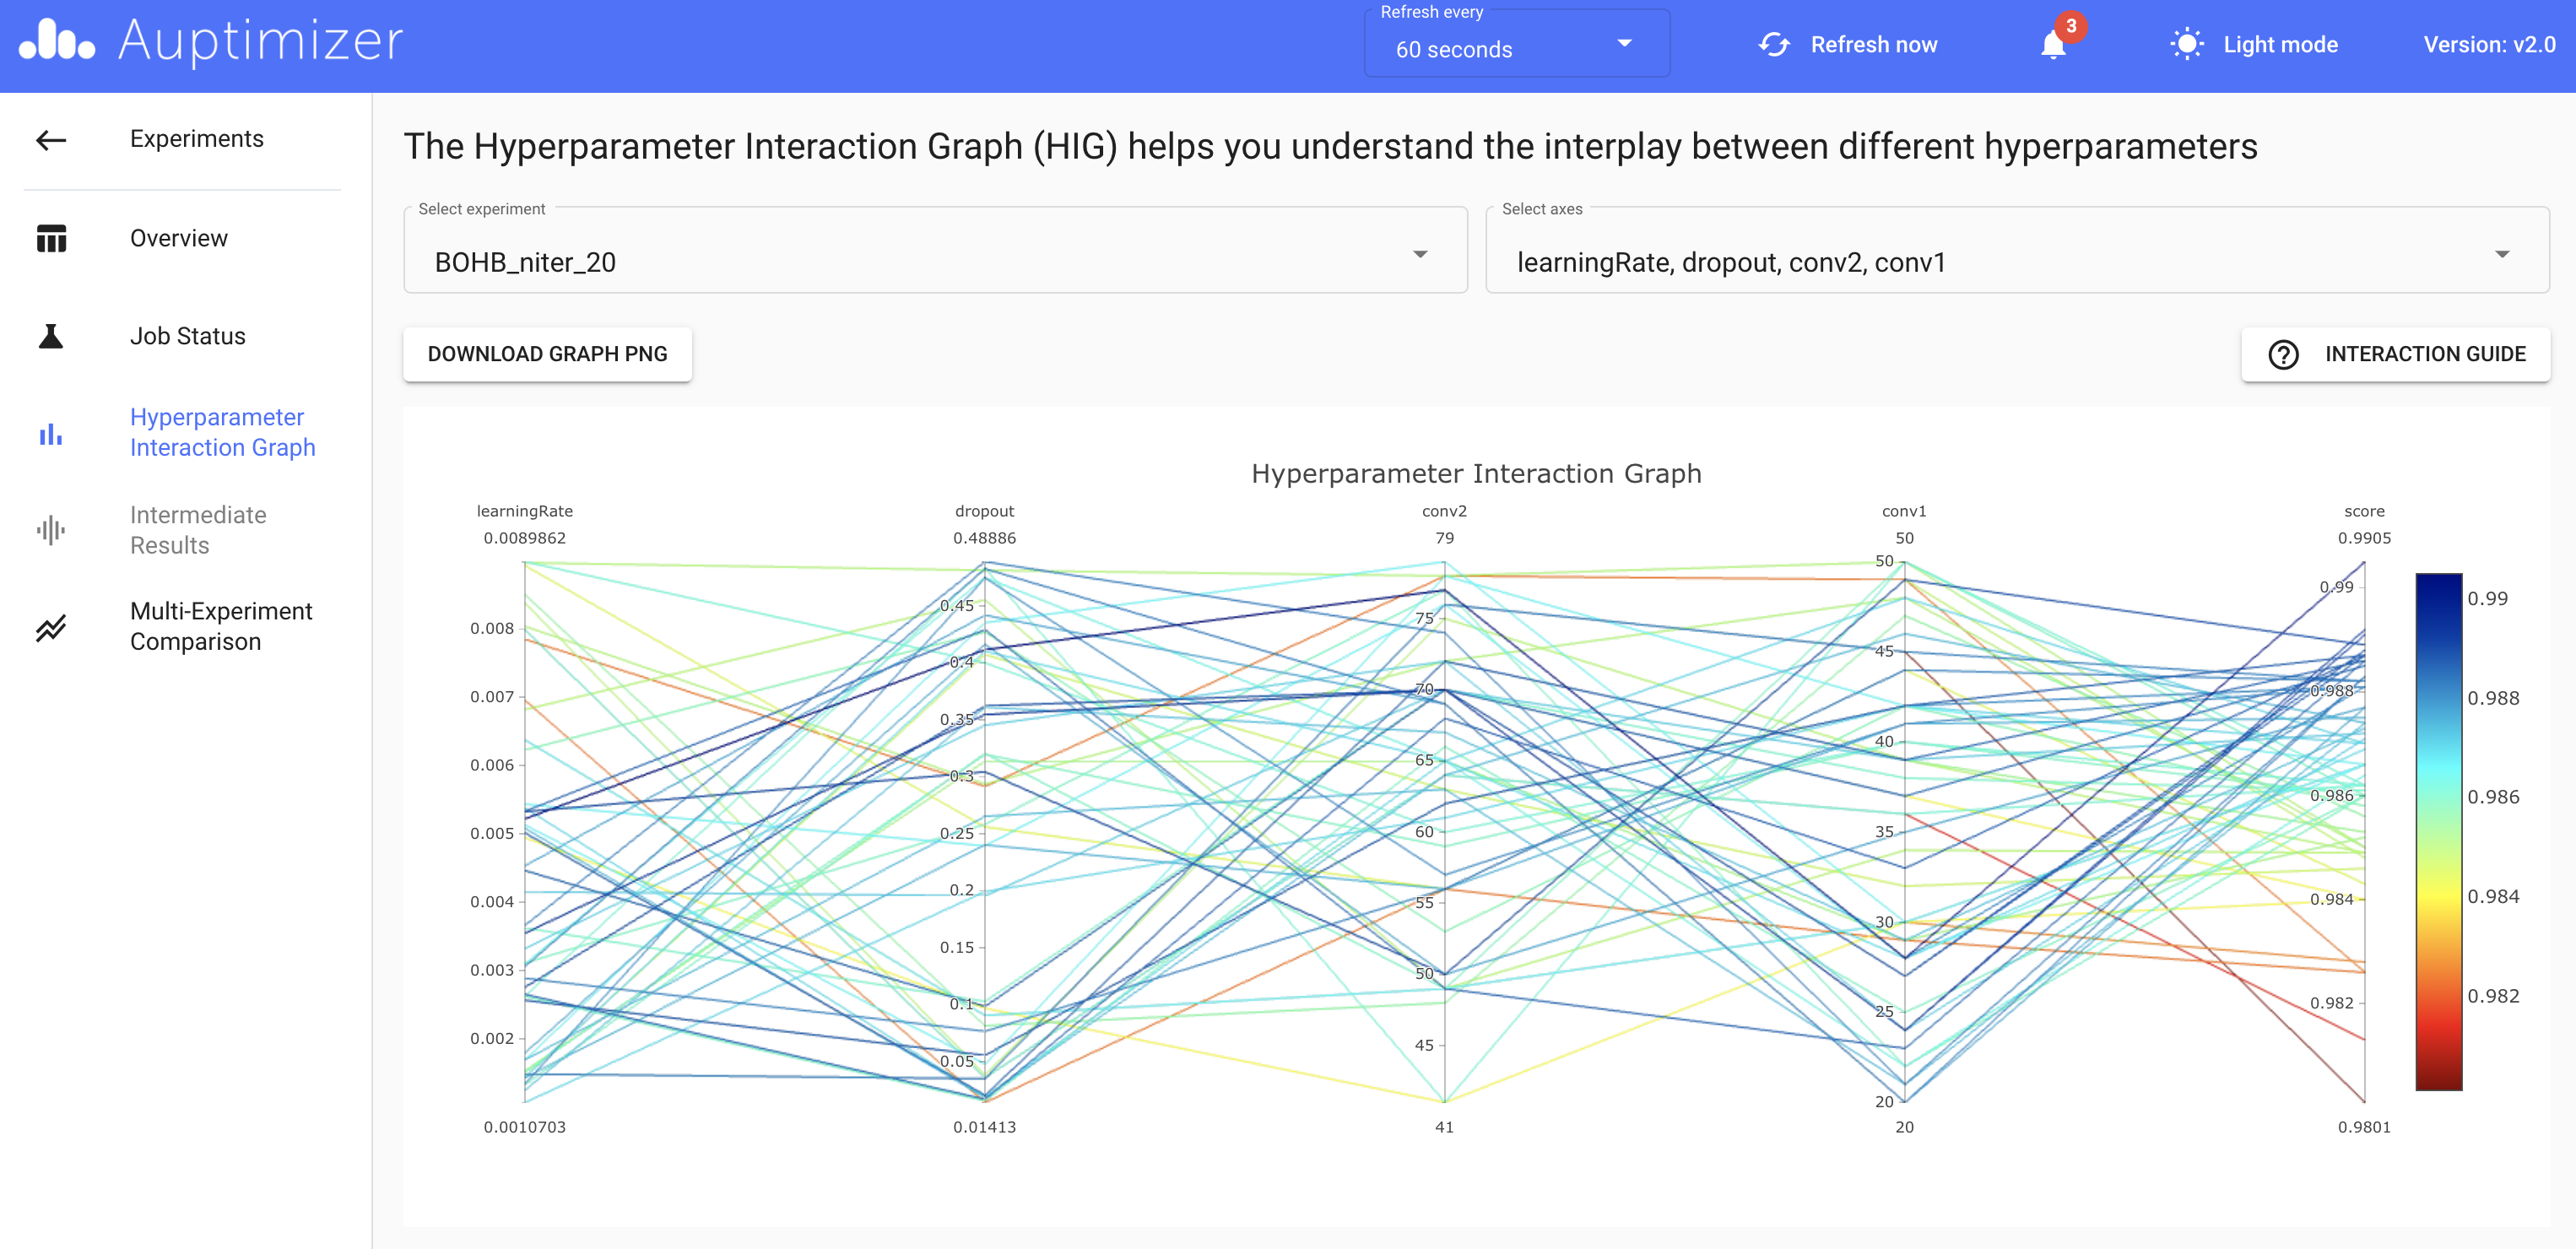
Hyperparameter Interaction Graph
Create new experiment
In addition to visualizing the results of existing experiments, you can also use the dashboard to create and run new experiments. There are two ways to do so:
click on the
CREATE NEW EXPERIMENTbutton on the main page,click on the
Create experiment from copybutton located on each experiment entry on the main page.
Both approaches will open the following page, where on the top you will need to specify your working directory for the
new experiment, and in the left panel, you can input the experiment configuration in json format. If you choose
Create experiment from copy, the configuration json file of the selected experiment will be copied over to the left panel for
further modification. The right panel is for validation purposes. You can check the argument values parsed from
the json file in the right panel to make sure everything in the configuration json file is correct.
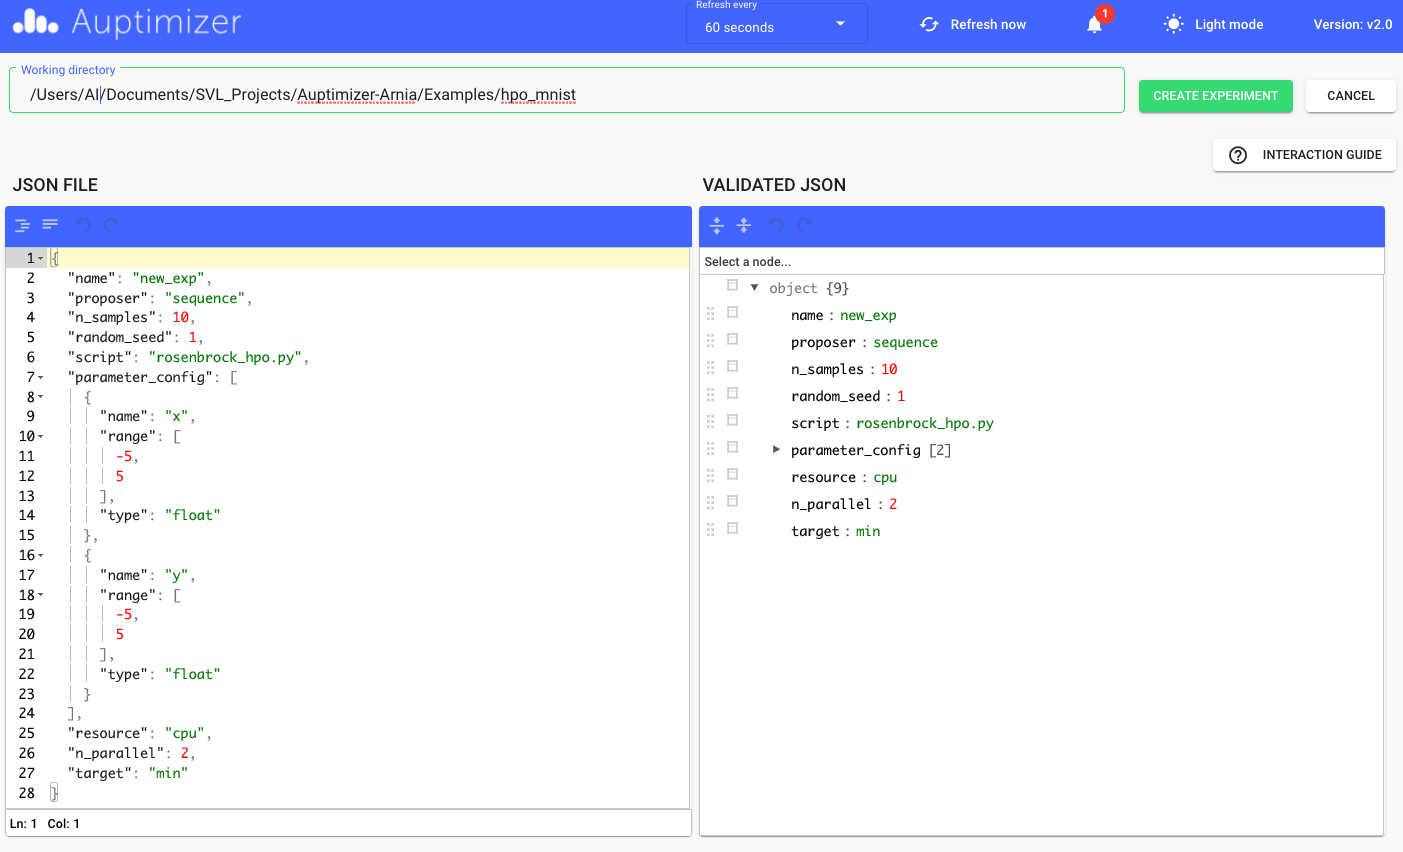
Create New Experiment
Please review the INTERACTION GUIDE for a complete guide on setting up the experiment. After clicking on
the CREATE EXPERIMENT button, this experiment will be shown on top of the experiment list on the main page. You can
click on the START button to run the experiment.
Reset Auptimizer environment
You can also reset the Auptimizer environment via the dashboard. After you click on the RESET AUPTIMIZER ENVIRONMENT button on the
main page, a software wizard will lead you through the Auptimizer environment set-up process.
Important: the existing Auptimizer environment in the same working directory will be overwritten, which will erase existing databases. We suggest the user back up their databases for finished experiments before resetting the Auptimizer environment in the same working directory.
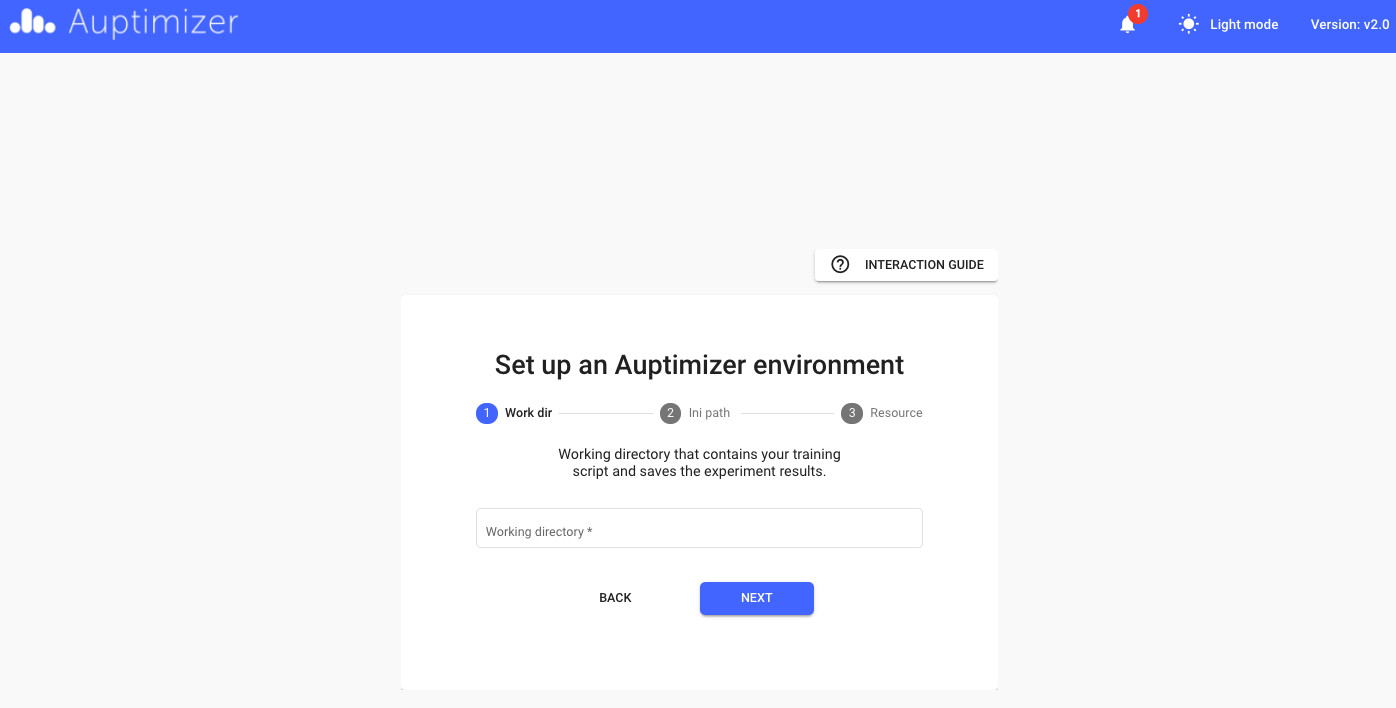
Set Up Auptimizer Environment
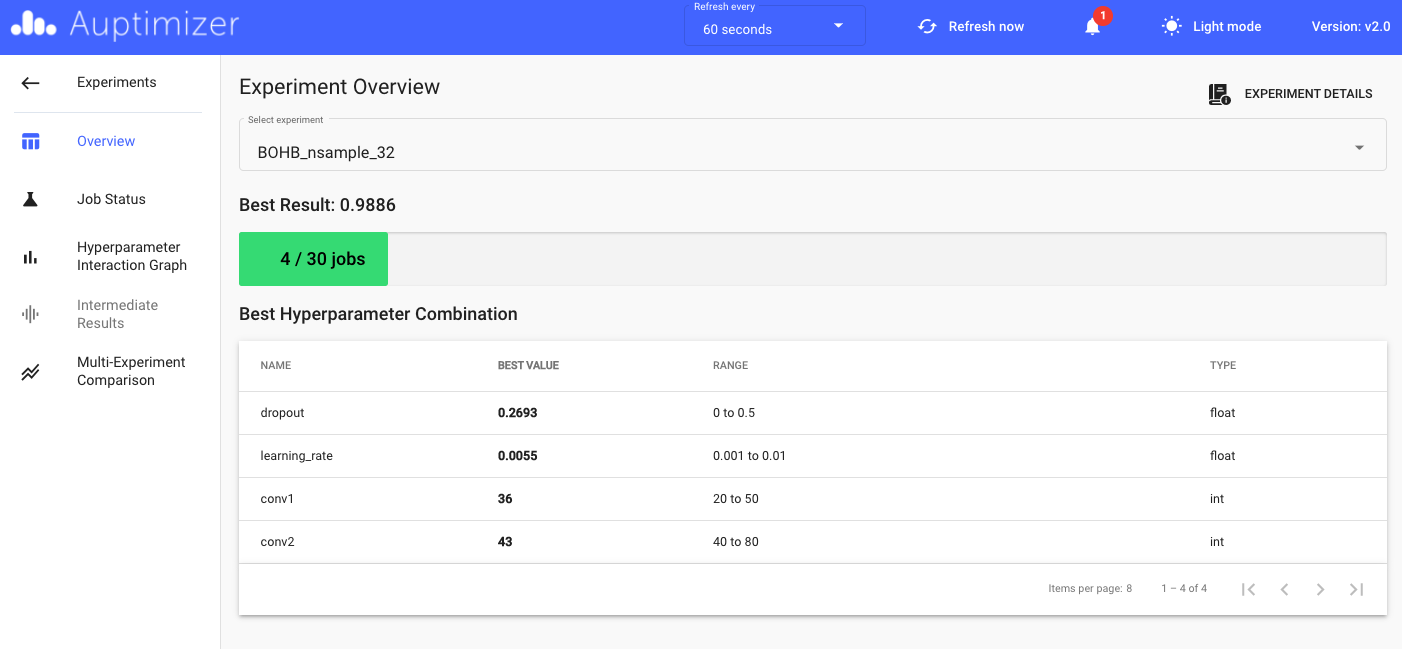
Compression experiments
For one-shot compression experiments, as each experiment contains only one job and there are no hyperparameters to be tuned or visualized, the dashboard will have a few modifications:
The Experiment Overview page will only show the experiment configuration instead of hyperparameters.
The Job status page will only show one job.
The Hyperparameter Interaction Graph page will not show a graph.
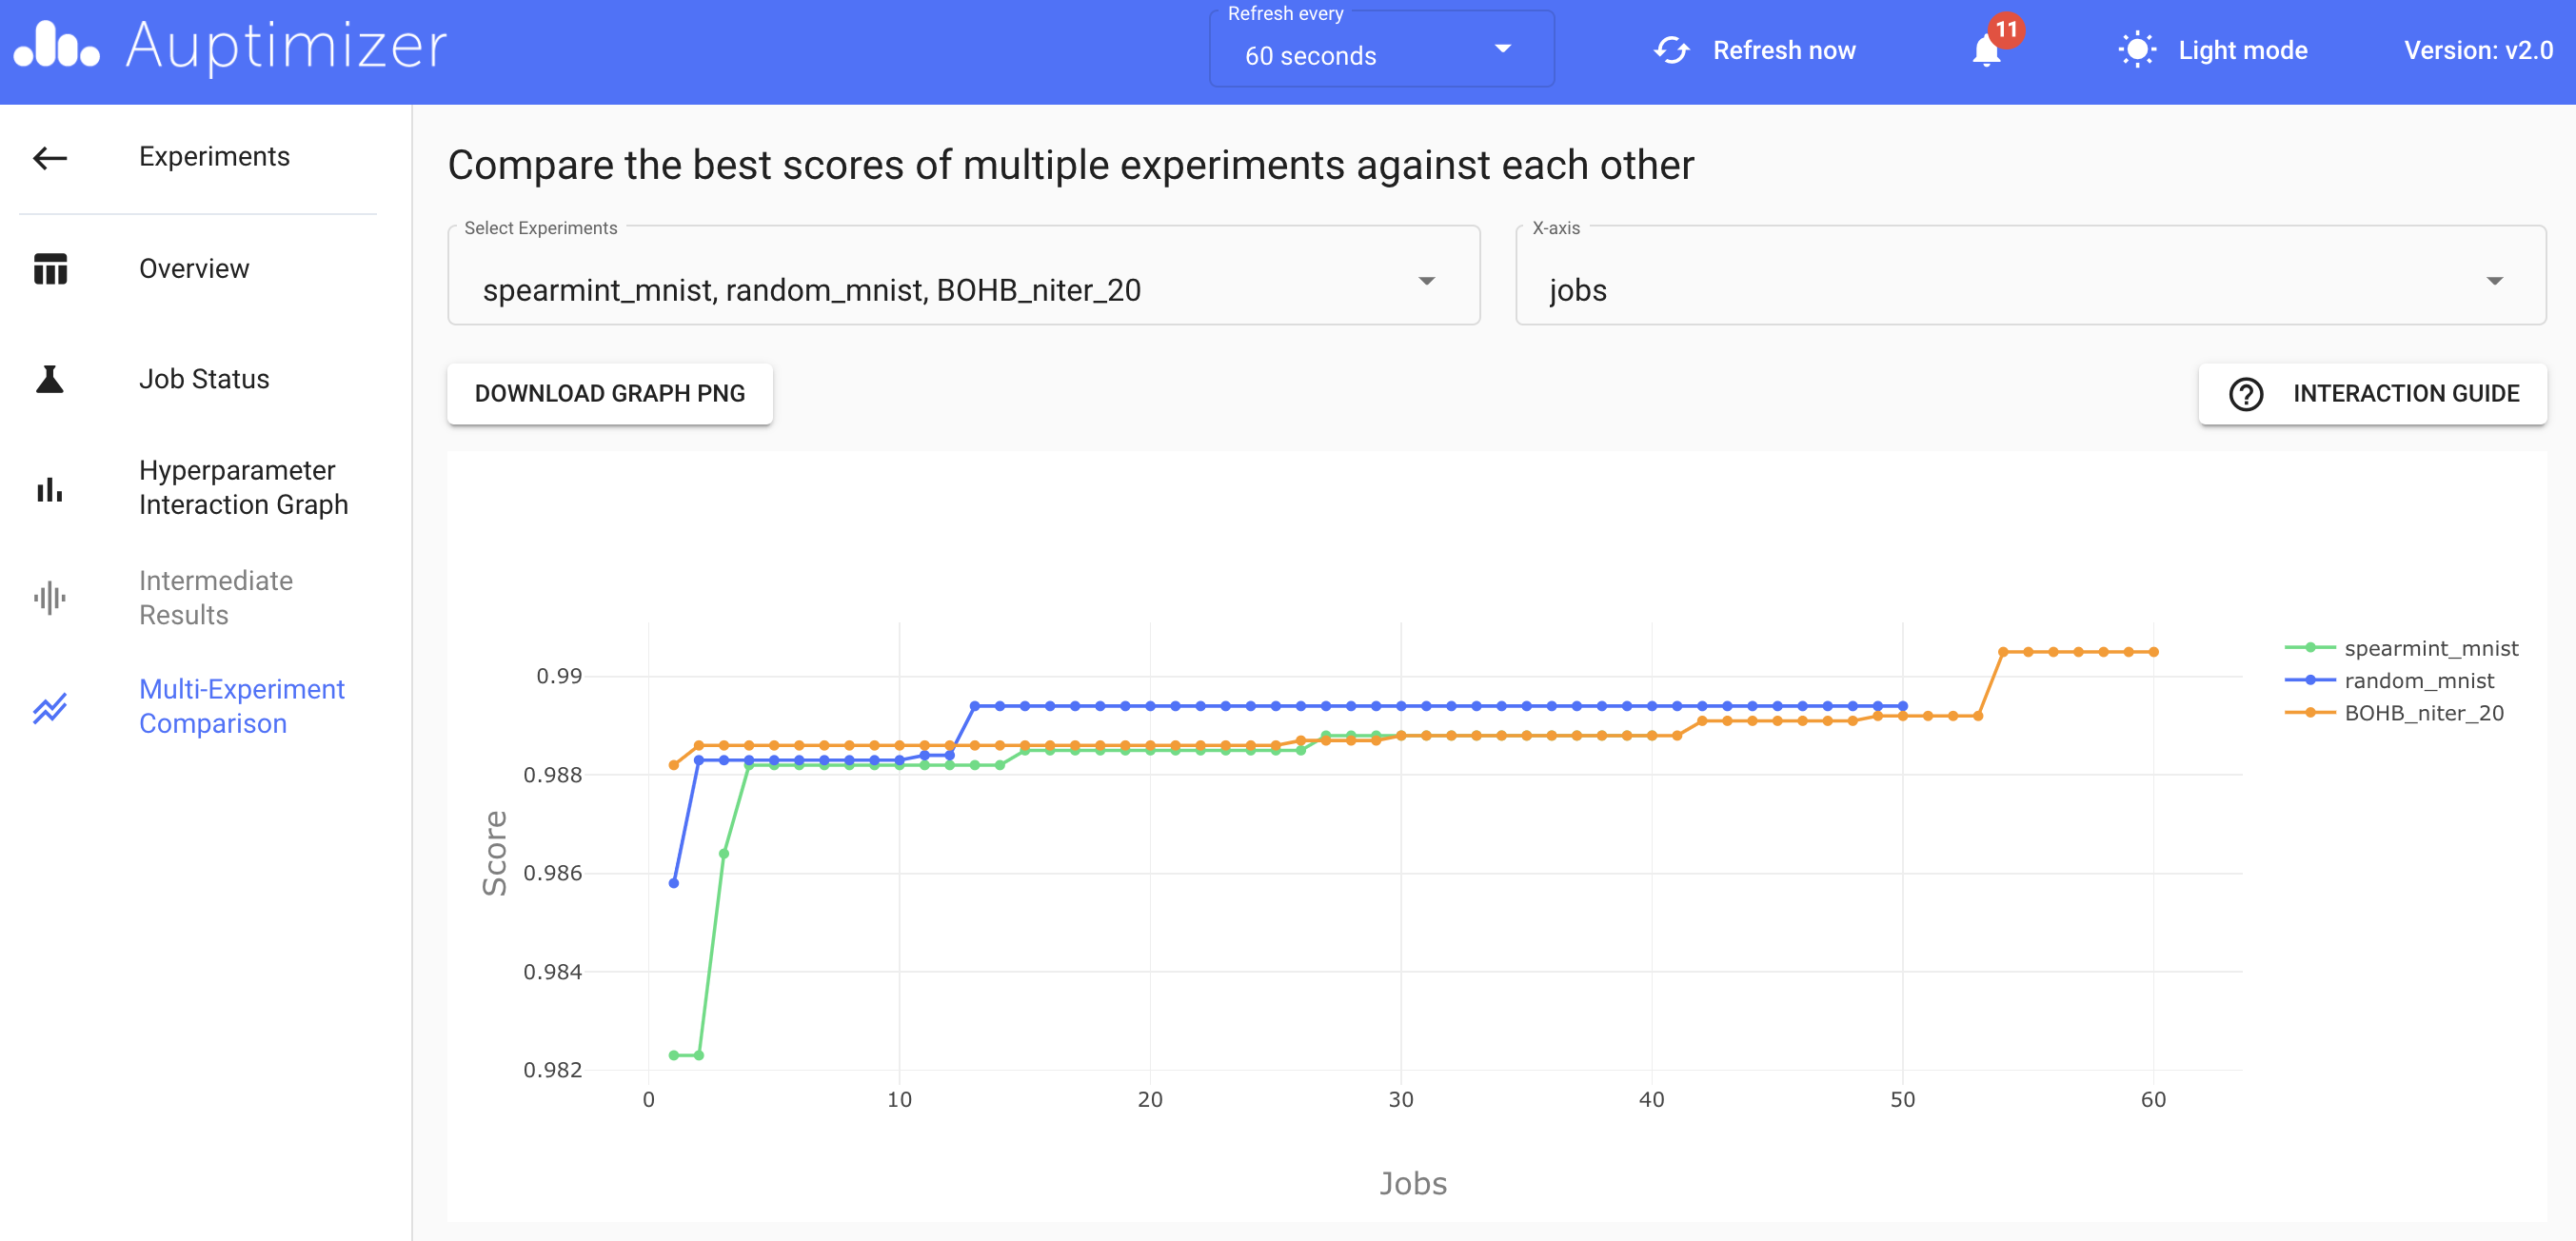
The Multi-Experiment Comparison page will show one data point for the experiment.
For automatic compression experiments, the dashboard will function in the same way as for the HPO experiments. Note that in compression experiments, the hyperparameter names may not be explicitly specified in the configuration file. For example, the target sparsity for multiple layers might be a single hyperparameter. However, on the dashboard, the hyperparameter names will be rephrased for better clarity.
Experiment Overview for Automatic Compression experiments
Hyperparameter Interaction Graph for Automatic Compression experiments